
12: Introduction to Technical Analysis
Reading the Language of the Market
Financial markets are often described as rational systems driven by economics, technology and global events. Yet beneath the surface lies another powerful force: human behaviour.
Every purchase reflects optimism. Every sale reflects caution, uncertainty or profit-taking. Together, millions of decisions create the movements that appear on a price chart.
Technical analysis is the study of these movements.
Rather than focusing on the intrinsic value of an asset, technical analysts examine historical price data, trading activity and market behaviour in an effort to identify patterns that may influence future price movements.
The discipline emerged long before the invention of cryptocurrencies. It was developed through centuries of observation in stock, commodity and currency markets. Today, the same principles are widely applied to digital assets, where price movements often display remarkable volatility and strong behavioural patterns.
Technical analysis does not claim to predict the future with certainty. Rather, it seeks to identify probabilities, helping traders make more informed decisions based on evidence rather than emotion.
In many respects, technical analysis is less about forecasting and more about understanding the ongoing conversation between buyers and sellers.
The Foundations of Technical Analysis
At its core, technical analysis rests upon several fundamental assumptions.
The Market Discounts Everything
Technical analysts generally assume that all publicly available information is already reflected in the market price.
News, economic conditions, technological developments and investor sentiment collectively influence buying and selling decisions. As these decisions occur, their effects become visible on the chart.
Rather than attempting to analyse every external factor individually, technical analysts focus on the resulting price action.
Prices Move in Trends
Markets rarely move in perfectly random directions.
Instead, they often develop identifiable trends that may persist for extended periods.
Recognising these trends forms a central component of technical analysis.
History Often Rhymes
Human psychology changes far more slowly than technology.
Fear, greed, hope and uncertainty have influenced markets for centuries.
As a result, similar behavioural patterns frequently reappear across different markets and time periods.
Technical analysis seeks to identify these recurring patterns and understand their implications.
Reading Price Charts
Price charts are the primary tools used by technical analysts.
At first glance, they may appear intimidating, filled with lines, colours and seemingly endless fluctuations. Yet every chart simply tells the story of how an asset's price has changed over time.
The horizontal axis represents time.
The vertical axis represents price.
Everything else is a visual representation of market activity.
Why Charts Matter
Charts allow traders to observe:
- Historical price movement
- Market trends
- Areas of support and resistance
- Volatility
- Momentum
- Potential trading opportunities
Without charts, traders would be forced to evaluate market conditions through isolated price figures rather than the broader narrative those figures create.
The chart transforms raw data into a visual language.
Types of Price Charts
Several chart styles are commonly used in financial markets.
Line Charts
The simplest form of chart is the line chart.
It connects closing prices over a specified period, creating a continuous line that illustrates overall market direction.
Advantages include:
- Simplicity
- Clarity
- Easy identification of trends
However, line charts omit much of the detailed information that traders often require.
Bar Charts
Bar charts provide additional information by displaying:
- Opening price
- Closing price
- Highest price
- Lowest price
Although more informative than line charts, they can appear cluttered, particularly for beginners.
Candlestick Charts
Today, candlestick charts are by far the most widely used format among cryptocurrency traders.
They combine detailed information with visual clarity, making them exceptionally useful for analysing market behaviour.
While both bar charts and candlestick charts display the opening, closing, highest and lowest prices for a given period, candlestick charts present this information in a more visual and intuitive format. A bar chart uses vertical lines with small horizontal markers to indicate the opening and closing prices, whereas a candlestick chart uses a coloured body to show the difference between the opening and closing prices, making it easier to identify bullish and bearish market sentiment at a glance. As a result, candlestick charts have become the preferred choice among most modern traders due to their clarity and ability to reveal market psychology more effectively.
Understanding Candlesticks
The origins of candlestick charting can be traced to eighteenth-century Japanese rice traders, who recognised that market psychology often influenced prices as much as supply and demand.
Centuries later, candlestick analysis remains one of the most powerful tools available to traders.
Each candlestick represents a specific period of time.
Depending on the selected timeframe, a candle may represent:
- One minute
- Fifteen minutes
- One hour
- One day
- One week
or any other chosen interval.
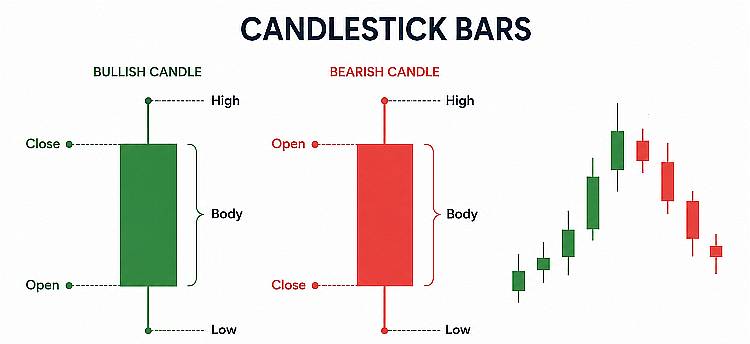
Anatomy of a Candlestick
A candlestick consists of two primary components.
The Body
The body represents the difference between the opening and closing prices.
If the price closes higher than it opened, the candle is generally displayed in a bullish colour (green).
If the price closes lower, it appears in a bearish colour (red).
The Wick
Thin lines extending above and below the body are known as wicks or shadows.
They indicate the highest and lowest prices reached during the period.
Together, the body and wicks provide a concise summary of market activity.
What Candles Reveal
Candlesticks reveal the ongoing struggle between buyers and sellers.
A strong bullish candle may indicate enthusiastic buying pressure.
A strong bearish candle may signal aggressive selling.
Long wicks often suggest uncertainty, rejection of certain price levels or increased volatility.
By studying candlestick behaviour, traders gain insight into market sentiment and momentum.
Support and Resistance
Among the most important concepts in technical analysis are support and resistance.
These levels represent areas where price has historically encountered significant buying or selling activity.
Understanding them helps traders identify potential entry and exit points.
Support
Support is a price level where buying interest tends to emerge.
When prices approach support, buyers often perceive the asset as attractive and begin purchasing.
This increased demand can slow or reverse a decline.
Support acts much like a floor beneath the market.
While not unbreakable, it frequently provides temporary stability.
Resistance
Resistance is the opposite.
It represents a price level where selling pressure tends to increase.
As prices rise toward resistance, traders may choose to take profits or reduce exposure.
This additional supply can slow or halt an upward movement.
Resistance acts as a ceiling above the market.
Why Support and Resistance Matter
Support and resistance help traders answer several important questions:
- Where might buyers enter the market?
- Where could sellers become active?
- Where should risks be managed?
- Where might trends pause or reverse?
Because many traders monitor the same levels, support and resistance can become self-reinforcing.
Markets often react to them simply because participants expect them to matter. And this makes the markets more predictable.
Role Reversal
One fascinating characteristic of support and resistance is role reversal.
A former resistance level may later become support once it is broken.
Likewise, previous support may become resistance after a decline.
This behaviour reflects changing market psychology and is observed across virtually all financial markets.
Understanding Trends
The famous market adage states:
The trend is your friend.Although simplistic, the statement contains considerable wisdom.
Trading in the direction of an established trend generally presents higher probabilities than repeatedly attempting to predict reversals.
Uptrends
An uptrend occurs when prices form:
- Higher highs
- Higher lows
Each successive rally exceeds the previous one, while pullbacks remain relatively shallow.
This structure indicates persistent buying pressure.
Downtrends
A downtrend forms when prices create:
- Lower highs
- Lower lows
Sellers consistently dominate market activity, preventing sustained upward movement.
Sideways Markets
Not all markets trend.
Sometimes prices move within relatively narrow ranges.
During these periods, buyers and sellers remain in balance.
These conditions are often described as consolidation or ranging markets.
Recognising the difference between trending and ranging environments is an essential trading skill.
Timeframes and Market Perspective
One of the most important lessons for new traders is that a chart can tell very different stories depending upon the timeframe being examined.
A market may appear strongly bullish on a daily chart while simultaneously displaying a short-term decline on an hourly chart.
Both observations can be correct.
Short-Term Timeframes
Shorter timeframes include:
- One-minute charts
- Five-minute charts
- Fifteen-minute charts
These charts provide detailed information but often contain substantial market noise.
They are primarily used by active traders seeking short-term opportunities who open and close positions within the same day.
Medium-Term Timeframes
Examples include:
- One-hour charts
- Four-hour charts
These timeframes often provide a balance between detail and broader market context. Many cryptocurrency swing traders rely heavily on the 4-hour chart because it filters out much of the noise while still providing timely signals.
Long-Term Timeframes
Long-term investors frequently examine:
- Daily charts
- Weekly charts
- Monthly charts
These charts reveal major trends while filtering out much of the short-term volatility. They are primarily used by investors who prefer to follow the trend enter and exit the market closer to bottoms and tops.
Multiple Timeframe Analysis
Experienced traders often analyse several timeframes simultaneously.
A typical approach may involve:
- Identifying the primary trend on the daily chart
- Refining opportunities on the four-hour chart
- Executing trades using the one-hour chart
This method helps align short-term decisions with broader market direction.
Technical Analysis as a Tool
Technical analysis is sometimes misunderstood as a collection of secret formulas capable of predicting future prices.
In reality, it is neither magical nor infallible.
Charts do not reveal certainty or the future, instead they represent the past historical data.
Charts reveal probabilities.
Successful traders understand that no indicator, pattern or chart structure guarantees a particular outcome.
Instead, technical analysis provides a framework for evaluating risk, identifying opportunities and making decisions within conditions of uncertainty.
It transforms market behaviour into information.
Seeing Beyond the Numbers
Price charts are more than collections of data points. They are visual records of human behaviour, capturing moments of confidence, fear, optimism and doubt.
Candlesticks reveal the battle between buyers and sellers. Support and resistance highlight areas where that battle has previously intensified. Trends demonstrate the collective direction of market sentiment, while timeframes offer different perspectives on the same unfolding story.
For newcomers to cryptocurrency trading, technical analysis provides a valuable lens through which to observe and interpret market activity. It encourages discipline, structure and observation rather than impulsive decision-making.
Although no chart can eliminate uncertainty, learning to read price action allows traders to navigate markets with greater awareness and confidence. In a world where emotions often drive financial decisions, the ability to interpret the language of the market becomes an invaluable skill.